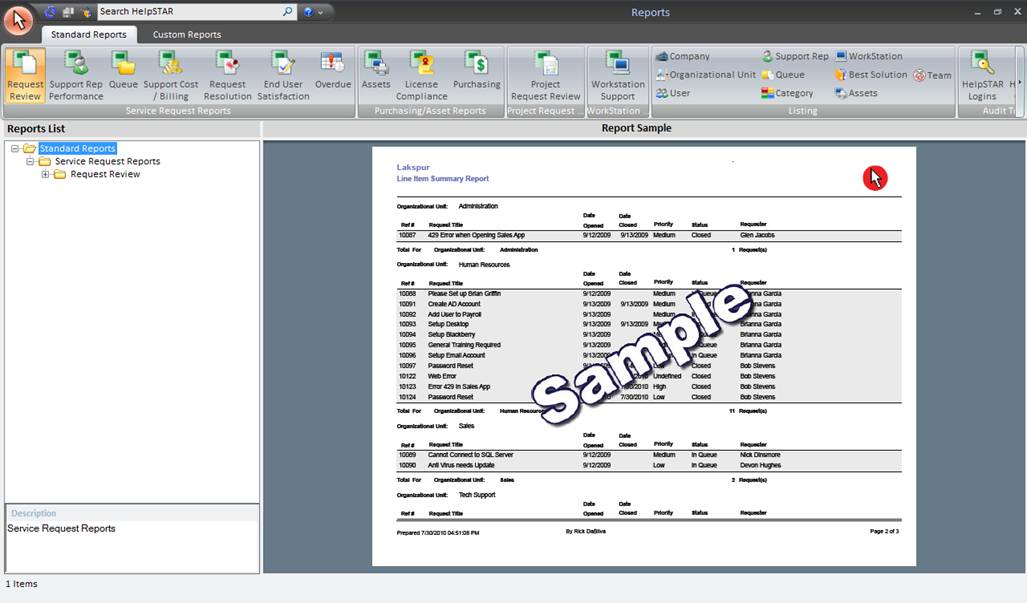
This section allows you to view a library of standard reports which are intended for you to examine the current state of your help desk, measure historical performance and identify trends and weaknesses of your help desk. You must have been granted the Report Privilege to use reports.

For standard reports, the Ribbon Toolbar below will appear:


Request Review Reports: View detailed or summary reports for service requests.
Support Rep Performance Reports: View detailed or summary reports for efficiency and work performed by a Support Rep.
Queue Reports: View detailed or summary reports for efficiency and work performed on service requests in a Queue.
Support Cost/Billing Reports: View cost of support by company or organizational unit as well as view billing rates.
Request Resolution Reports: Reports related to resolution statistics of your help desk.
End User Satisfaction Reports: View reports related to Approval Ratings provided on closed requests. For more information, see Approval Ratings.
Over Due Reports: View summary reports of over due requests.

Assets Reports: View reports related to asset allocation, cost and support.
License Compliance Reports: View reports related to the software installed on machines on your network and whether your organization is compliant with the number of licenses owned. For more information, see License Compliance.
Purchasing Reports: View reports related to any outstanding Purchase Orders.

Workstation Support Reports: View reports related to time and cost of support workstations on your network.

View complete Report Listings of the following HelpSTAR objects added in your system:

HelpSTAR Logins: View a report listing successful and failed logins to HelpSTAR (via the Windows Client and the Web Portal)
HelpSTAR Objects: View reports related to modifications made to HelpSTAR objects.
In the Report List pane, a listing of reports will appear for the selected option in the toolbar. Available reports shown in the reports list view for each button are discussed below:

Report List Tree-view for Request Review Reports:
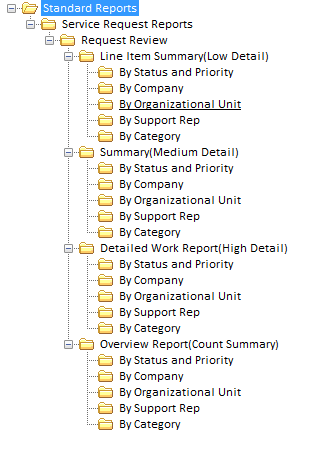
This report shows one line summaries of all requests within a specified date range. With this report, you can scan request titles to get an instant look at the issues logged to your help desk. There are five Line Item Summary Reports available under Standard Reports, as shown below.

For each request, a Line Item Summary Report includes Ref #, Request Title, Date Opened, Date Closed, Priority, Status and Requester Name. The Date Opened and Dated Closed columns provide you with a good idea of how quickly requests are being resolved. You can also scan the request summaries to get an instant overview of their priorities and status.
This report shows detailed summaries of all requests within a specified date range. There are five Summary Reports available under Standard Reports, as shown below.

For each request, a Summary Report shows the same comprehensive summary as a Detailed Work Report but does not include the memos. The summaries allow you to quickly scan requests without getting overwhelmed by the memo details. You can focus on specifics such as current category, queue, support rep, status or priority.
Take an in-depth look at the work that flows through your help desk. Within the date range that you select, you can view all of the memos created for each request in chronological order. This provides you with a comprehensive look at each request's workflow, as well as the work performed by your reps. There are five Detailed Work Reports available under Standard Reports, as shown below.

For each request, a Detailed Work Report includes a comprehensive summary of the request, plus all related memos in chronological order.
This report shows counts of service requests based on the HelpSTAR objects shown below. Generate this report if you are looking for quick counts of service requests without any request detail. This provides you an opportunity to generate simple numbers of requests flowing through your helpdesk through the five objects as shown below:
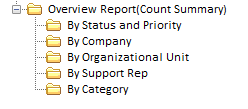
For each object, a count of requests will appear plus the grand total.

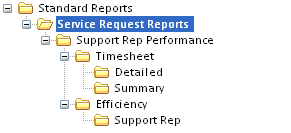
Provides a summary of all work completed by your Support Reps, within a specified date range. This report can be used to ensure that Support Reps are spending an appropriate percentage of time working on requests. There are two Timesheet Reports available under Standard Reports, as shown below.
![]() `
`
Detailed Timesheet Reports: For each request, these reports present the details of all memos entered by your reps, plus brief summaries. Memos are grouped by support rep within each group by the day work was performed. At the end of each daily sub-group, the number of requests is shown along with the number of hours spent working on them.
Summary Timesheet Reports: These reports show one-line summaries of all memos entered by your support reps. This report is similar to Detailed Timesheet Reports except that they do not show the memo text. Memos are grouped by support rep within each group by the day work was performed. At the end of each daily sub-group, the number of memos and requests is shown along with the number of hours spent working on them. The total number of memos, requests and time worked is shown at the end of each support rep group.
The Support Rep Efficiency Report provides a one-line summary for each request closed during the reporting period. Information provided includes Time Worked (Hours), Time In Service and the request’s Title.
Note that the statistics for time "In Dispatch", "In Queue" and "In Service" will be more relevant if your organization’s Business Hours has been configured (unless your help desk never closes).
![]()
![]()

The Queue Efficiency Report lists, by Queue, all requests that were CLOSED within a selected range. The requests will be grouped according to the last Queue they were in. Requests that were never in a Queue will also be omitted. For every request listed, you will be shown the ID #, Date Opened, Date Closed, Title, Priority, Hours in Dispatch and Days In Queue.
Note that the statistics for time "In Dispatch", "In Queue" and "In Service" will be more relevant if your organization’s Business Hours has been configured (unless your help desk never closes).


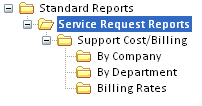
Support Cost/Billing Reports provides a quick overview of the rates used in billing the clients your organization supports. Billing rates, along with time worked, are used to calculate the charges that are shown in the Semi-Detailed Billing Reports for companies and Organizational Units.
There are three Billing Reports available under Standard Reports, as shown below.
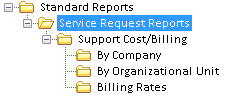
Semi-Detailed Billing Reports allow you to provide detailed summaries of your support reps’ time worked and associated charges for your customers. These reports will be shown for external clients (Companies) or internal clients (Organizational Units of your own organization). An internal billing report can assist the Help Desk manager to identify over or under-utilize resources and can also be used in conjunction with your internal accounting system to generate revenue for the Help Desk.
For each request, the Company and Organizational Unit reports include a summary of the request, plus a one-line summary for each memo in chronological order including the Memo Date/Time, Memo Type, Author, Time Worked and related Charges. Total Time Worked and Charges are also calculated for each Company or Organizational Unit.
The Billing Rates report shows one-line summaries of the hourly rates individually assigned to each of your support reps.

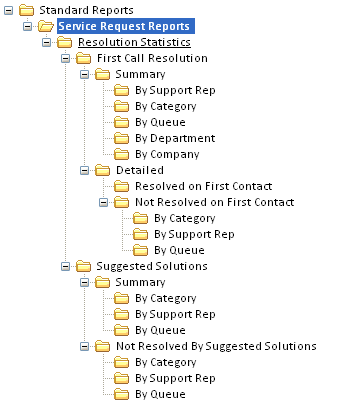
There are two kinds of First Call Resolution Reports and Summary and Detailed, as shown below.

Summary Reports: These reports show the number and percentage of requests that have been resolved on first contact. They also include the number and percentage of requests that were resolved on first contact by a Suggested Solutions. This will allow you to determine how effective your Suggested Solutions are in facilitating First Call Resolutions.
Detailed Reports: There are two reports that provide detailed looks at requests that have either been resolved or not resolved on first contact. Within a specified date range, the reports will include a comprehensive summary of each request plus all related memos in chronological order. By examining these reports you will be able to determine why some requests are being resolved on first contact while others are not. This information may assist you and your support reps in finding ways to improve the help desk’s rate of first call resolution.
There are two kinds of Suggested Solution Reports and Summary and Not Resolved by Suggested Solutions, as shown below.
The Summary reports show, within the selected date range, the number and percentage of closed requests that were resolved by Suggested Solutions. This will allow you to determine the effectiveness of Suggested Solutions in resolving requests. These reports can be grouped by Category, Support Rep and Queue.
The remaining reports show the details of all closed requests that were not resolved by Suggested Solutions. Within the date range that you select, the reports will include a comprehensive summary of each request plus all related memos in chronological order. This will allow you to examine how effectively your reps are utilizing Suggested Solutions and may reveal areas where additional Best Solutions are needed. These reports can be grouped by Category, Support Rep and Queue.

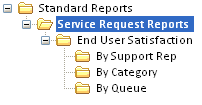
User Satisfaction Reports are based on Approval Ratings given to requests. These reports break down (by count and by percentage) satisfaction levels with respect to both timeliness and quality of service. User Satisfaction Reports only include requests that have received Approval Ratings. Non-rated requests are not included.
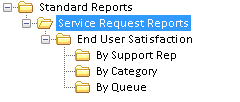
There are three User Satisfaction Reports available under Standard Reports, as shown below.
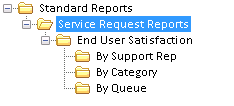
The satisfaction "By Queue" and "By Category" reports let you see how well your help desk is servicing particular types of requests. Whereas the satisfaction "By Support Rep" report lets you see how each of your Support Reps are performing.


The Over Due Report provides you with a comprehensive look at each request's workflow. All memo updates are shown, including those automatically generated by the StarWatch Service, and user updates where no memo text was entered (e.g. a manual change in priority, due date, etc.). This allows you to see everything that was done with the request and better understand why it has become over due.
The Over Due Report enables you to take an in-depth look at requests that are past their Due Date. All over due requests are included in this report and are grouped by requester. An Over Due Report includes a comprehensive summary for each request plus all related memos in chronological order.

![]()
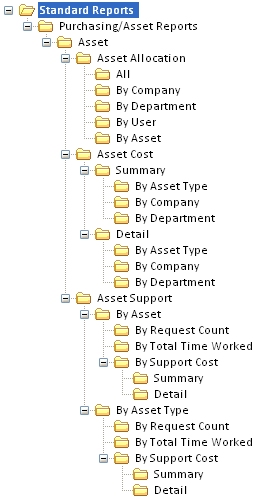
There are three kinds of Asset Reports and Asset Allocation, Asset Cost and Asset Support, as shown in the graphic below:
Asset Allocation Reports allow you to quickly locate assets and to see assets which are not allocated. They can also be used to verify inventory against the physical assets.
There are 5 Asset Allocation Reports, as shown below:
All: All assets, including non-allocated assets, grouped by asset type.
By Company: All assets allocated to companies
By Organizational Unit: All assets allocated to Organizational Units
By User: All assets allocated to users
By Assets: All assets allocated to other assets
Asset Cost Reports: There are two kinds of Asset Cost Reports and Summary and Detail.
Summary: These reports show the cost of assets acquired within a specific date range, grouped by asset type. Using different groupings you can view a summary of the asset cost allocation for each company/Organizational Unit or the overall expenditure by asset type.
Detail: These reports show a detailed breakdown of the cost of assets acquired within a specific date range, grouped by asset type. With these reports you can analyze your main cost areas and investigate high expenditures.
Note 1: Asset Cost reports "By Company" show the costs of assets allocated to companies, including assets allocated to other assets. These assets can then be allocated to companies, and assets then allocated to external users.
Note 2: Asset Cost reports "By Organizational Unit" show the costs of assets allocated to Organizational Units, including assets allocated to other assets. These assets can then be allocated to Organizational Units, and assets then allocated to internal users.
Asset Support Reports: These reports allow you to identify your organization’s most troublesome assets, or those that have incurred the highest support costs. You can use this information to service or replace problem assets, schedule maintenance visits, rotate spare equipment, etc. The reports show all assets that have been associated with service requests via the Item field.
You can select from reports that rank assets in descending order by those having:
The most associated requests
The most request time worked
The highest costs (hourly rates x time worked).
If your organization has defined Asset Types then you can run Asset Support reports that group problem assets by Asset Type.


Two License Compliance reports can be run, as shown below.
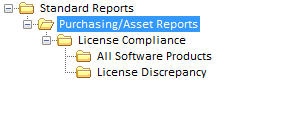
These reports allow you to compare the instances of software discovered by the Network Audit Service with the corresponding software assets in your HelpSTAR database. One report shows the license compliance for all software products, and the other shows only the software products where there is a discrepancy between the number of Owned and Installed software products.


The Purchasing Report allows you to follow up with Vendors regarding the delivery of their products. Within the date range that you specify, the report will show all products that have not been received or that have only been partially received. These products are grouped by Vendor and within each Vendor by PO#, as shown below.
There is one Purchasing Report available under Standard Reports, as shown below.
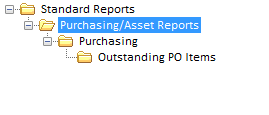
The Purchasing Report shows all products that have been ordered but not yet received. When you run the report you will be prompted to specify a date range for the Issue Date (i.e. the date the PO was generated).

The Project Request Reports allow you to generate review the status of your current projects. With a date range you specify, select a report that will show you all tasks associated with open projects as well as the amount of time spent on each tasks, and the project as a whole. The report will also group projects by Project Template or Ad-Hoc type. Therefore, any requests created by request merging vs. those create with a project template will be differentiated.
There are two Project Request Reports available under Standard Reports, as shown below:

Summary Report: This report will list any projects that exist in HelpSTAR. It will provide Project Request Title, Reference Number, Project Requester, Status, Company, and Time Logged. Most importantly, it will list the number of children tasks associated with it as well as the total time amount of time worked on a project.
Detailed Report: This report will list any projects that exist in HelpSTAR. With more detail, it will also list individual tasks and the amount of time spent on each task associated with the project.

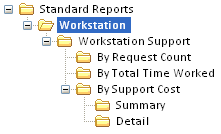
These reports allow you to identify the most troublesome assets in your organization. Reports can be generated to view the number of requests logged for a particular asset, as well as the support cost and time spent on that asset.
The report types available for workstation support are as shown below
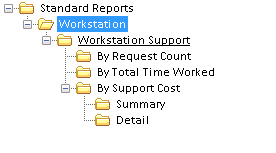
These reports can be used to determine which assets require service or replacement, reducing support calls from end users about these assets. The asset details are show first, followed by a line item for each associated service request.

Listing Reports allow you to select an object and list all instances of that object in the HelpSTAR database. There are seven Listing Reports available.
For each object, the following data is included in its listing report.
Company: Company Name, Phone, Fax, Address, Memo and associated Users.
Organizational Unit: Organizational Unit Name and associated Users.
User: User Name, Company/Organizational Unit, Phone, Extension, Fax, Email Address, Workstation ID, Location, Network Address, Internet Address, Support Rep Status, Login Enabled Status, Email Enabled Status, Privileges, User Memo and Inventory Memo.
Support Rep: Support Rep Name, Open Quota and Queue Assignments.
Queue: Queue Name and Support Reps Assigned.
Category: Category Name
Workstation: List of all audited workstations
Best Solutions: ID#, Title, Category, Draft/Published, No. of Times Suggested, No. of Requests Resolved, Solution Effectiveness (%).
Assets: List of asset name, allocation, serial number, asset tag and vendor.
Team: List of all teams and their associated Support Rep members.

Audit Trail reports allow you to track important information pertaining to modifications made to your HelpSTAR objects. You can also generate a login reports that will list successful and failed logins.


This report will list successful and failed logins. Sorted by date, it will list the user who logged in, logged in and out times, HelpSTAR interface type (client vs. web) and the version from which they logged in.

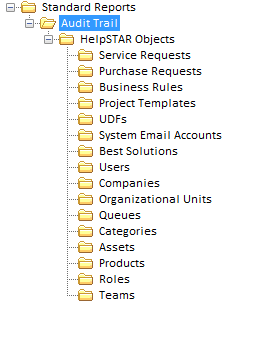
These reports will list any modifications made to any of your HelpSTAR objects. Depending on the object, it will show you the object id, title, modification type (de-activated, deletion or modification), from which workstation the modification was made, interface type (client vs. web interface) and HelpSTAR version.

This section displays a sample report to show you what the report selected in the Report List Tree-view section will look like. This allows you to assess whether or not the selected report provides the information you require.
See Also: