Query Designer
Overview:
The Query Designer allows you to create a custom query to
extract a list data from HelpSTAR based on custom filter criteria that you
set.
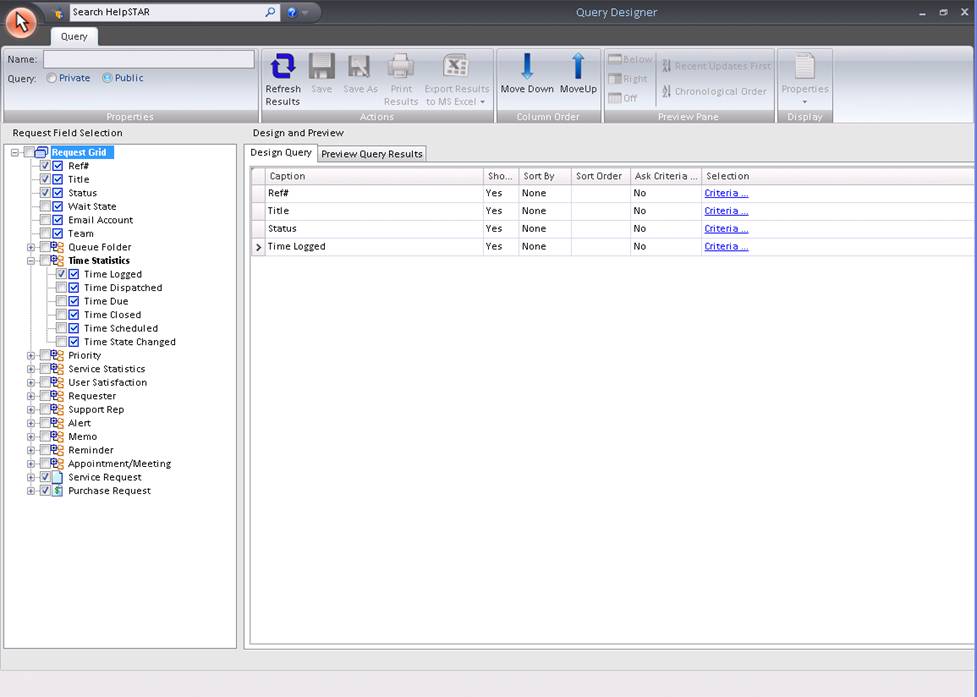
1. Ribbon Toolbar:

Properties:

- Name: This section allows you to enter/view the name
of the query.
- Public/Private: Define if the query you have created
will be viewable to other users.
Actions:

- Refresh Results: Refresh contents of the query
results.
- Save: Save the current query that you are working on.
- Save As: Save query as a different name, while
maintaining the query of the original name.
- Print Results: Print contents of the query results.
- Export Results to MS Excel: Open the results, after
running your query, in excel.
-
Export as displayed: export data as the text data as it appears in HelpSTAR
(associated with service statistics such as time worked)
-
Export as raw data: export data as a numerical value so that it can be
manipulated in Excel.
Column Order:

- Move Down: Move a line item in the "Query
fields and conditions” section down one line.
- Move Up: Move a line item in the "Query
fields and conditions” section up one line.
Note: The order that items are listed in the "Query fields and
conditions” section is the same order that query results will be displayed.
Preview Pane:

This section allows you to select how you would like to view the Query List
(grid) and the Query Detail. You can select from the following:
- Below: View Query Detail below the Query List.
- Right: View the Query Detail in a panel to the right
hand side of the Query List.
- Grid Only: View only the Query List.
- Recent Updates First: View most recent updates of the
request in the preview pane.
- Chronological Order: View updates to a request in the
order in which they were inserted.
Display:

- Transaction Type: This section allows you to select
the information you would like to view in the Date Logged Detail section.
For example, to view only Reminders sent from this request, select Reminders using the drop-down menu.
- Properties: This section allows you to select which
information you would like to view in the Request Properties section.
2. Request Field Selection:
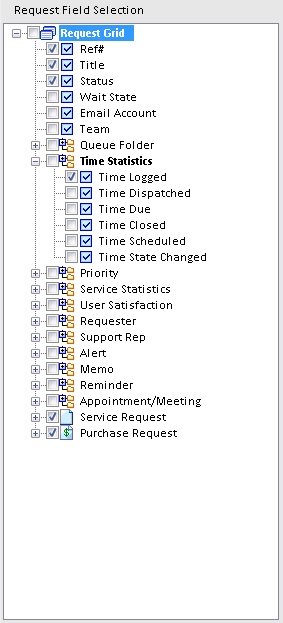
This section allows you to select database fields which you would like to
define criteria to filter information.
i.e.
To query requests by a certain status, you would check the "Status"
option. Then, in the "Query Fields and Conditions" section, you would
further specify which status you would like to query on.
3. Design and Preview:
Design Query Tab:

This section displays the database fields you selected in the "Tree-view of
Database Fields" section, and allows you to select the following options:
- Caption: Change the caption of the field. This
will only reflect on your Query Results, not in the entire application.
i.e.
If you changed Status to "State", it would only be reflected in the "Query
Results" title bar.
- Show Field: Define whether you would like this field
to be displayed in your query results. By selecting no, the criteria for
the query is set but this field will not appear in the result set.
- Sort By: You can define how this field should be
sorted.
- None: You would like to have no sort set;
results will be displayed in no specific order.
- Sort Order: If you have selected more than one item to
"Sort By", then this section allows you to define which sections to sort first
by assigning it a number. The number range will be based on how many
items have Ascending or Descending set for "Sort By".
i.e.
First sort by Time Logged, then sort by Status.
- Ask Criteria on Execution: This section allows you to
define whether you should be prompted for criteria each time you run this
query.

- Yes: Each time this query is run, you will be
prompted to define criteria for the section which you selected ”Ask Criteria
on Execution - Yes”.
- No: You will receive no prompt asking for
criteria. Any criteria set (if any) will remain.
- Selection: This section allows you to
specifically define what you are looking for. If you selected Status
from the "Tree-view of Database Fields", then this is the section for you to
specify your criteria.
i.e.
Status is not equal to Closed
Status is equal to In Service
Preview Tab:
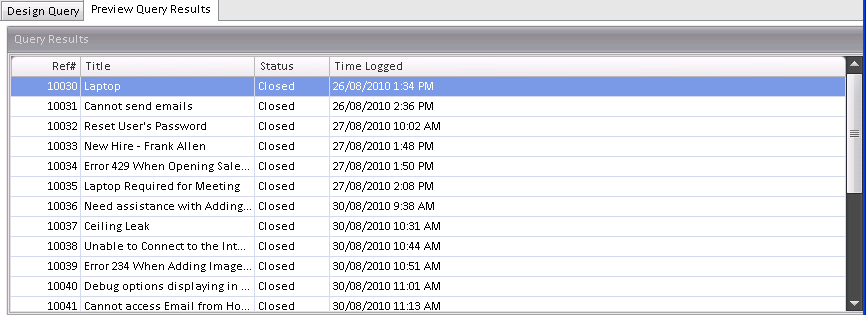
Select this tab to view a listing of all requests that meet the conditions
you set. This will help you see if you have set up your query
correctly. This section contains 2 distinct work areas:
- Query Results List: This section displays the result
set based on the filters you set in your queues. You can export this
information to excel by selecting the "Export Results To MS Excel" button in
the toolbar.
- Query Results Detail: This section allows you to
preview the request details for the item selected in the "Query Results"
section. From here you can update the request, delete it, send an email
to the requester, set a follow up to yourself or another support rep, etc.
This section contains two tabs:
- Transaction Tab: Here you will find a listing of the
memos for the request showing all of the activity for that request.
- Properties Tab: This section shows you all the
general information about the request.
An example of a query that you can create
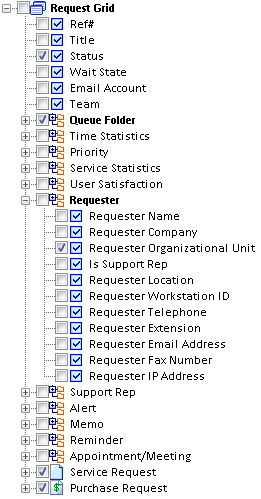
If you would like to see all requests (Service and Purchase Requests) that
are currently active and were created from a user in your Tech Support
Organizational Unit, you would select the following in the Tree-view of Database
Fields:
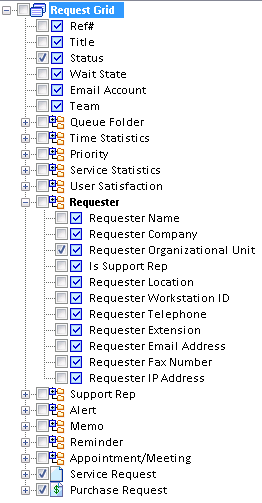
In the "Query fields and conditions" section, for status, select the
following criteria:
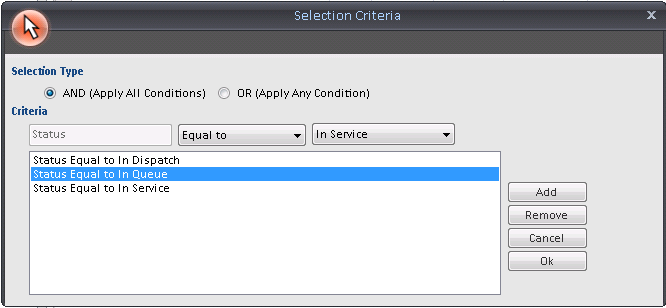
AND/OR Operators:

Note: The selection Type is set to "OR" rather than "AND". This
is because the request cannot be In Dispatch, AND In Queue, AND In
Service. The request can only be in one of these states. If you were
to select the "AND" operator in this example, your query would contain no
results. It is not possible for a request to meet that criteria.
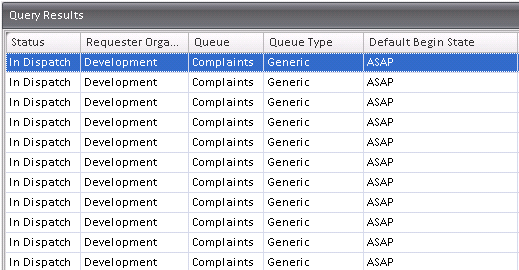
The way this query is set up so far, your result set will only display the
Organizational Unit Name of the Requester, and the state the request is in
(shown below).

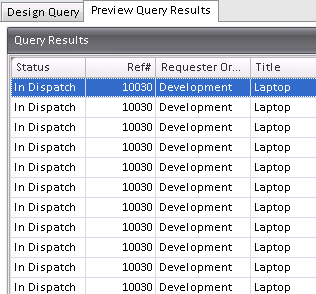
If you wanted to view more information in the output from your query, you
could select further options (shown below), and set no criteria for them.

In this case, we have added in Ref#, and Title (shown below).

Back to top
See Also:
Dashboard
Dashboard
Designer
Charts
Custom
Reports


![]()
