This section enables you to determine which active requests are close to exceeding, or have already exceeded, your organization’s Service Level Agreements for Response and Resolution times. These charts will help you determine which requests need to be escalated, and inform you of the efficiency of your help desk.


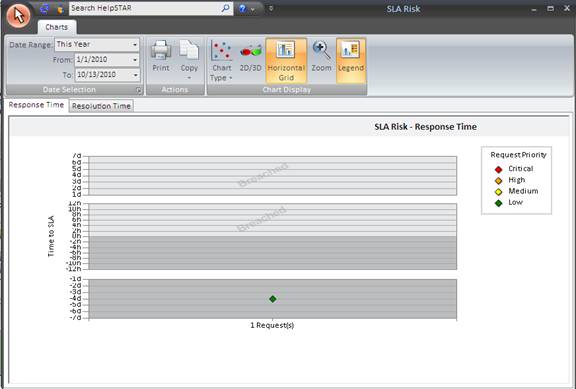
Click on the Response Time Tab to view the chart shown below:

The SLA Response Risk chart shows active requests that have not yet been responded to (as defined by your organization’s Response Time SLA). The requests are color-coded according to their current priority. The bottom area (below 0 hours) shows requests that are currently within their SLAs, while the top area (above 0 hours) shows requests that have breached their SLA
The location of each request in the graph is relative to the "0h" (0 hours) axis. A request that is above this horizontal axis has breached the SLA in accordance with the time shown in the vertical grid ("Time To SLA" - up to 7 days). A request that is below the horizontal axis is still within its SLA, as shown by the time in the vertical grid. The chart does not show requests that are more than 7 days above or below their Response Time SLA. You can click any request (i.e. its point in the chart) to view its details.
Click on the Resolution Tab to view the chart show below:
(Insert Image)
The functionality of the SLA Resolution Risk chart is similar to that described above, except that it shows active requests that have not yet been resolved (as defined by your organization’s Resolution Time SLA).
See Also: